Chart © SSPA
June 2026 was marked by mixed performances across global equity markets. While US equities posted slight losses, European and Japanese markets delivered a strong advance. The S&P 500 declined by 1.1%. Large-cap technology stocks weighed on overall performance, as investors voiced growing doubts about the continuation of the artificial intelligence boom. Elevated valuations in the technology sector also raised concerns. By contrast, European and Japanese markets had a particularly strong month. The EURO STOXX 50 rose by 4.6%, while the NIKKEI 225 gained 5.6%.
Over the second quarter of 2026 as a whole, global equity markets recorded their best performance in six years. In addition to the rally driven by artificial intelligence, the asset class benefited from a fragile ceasefire between the United States and Iran. With the gradual reopening of the Strait of Hormuz, oil prices fell back to their lowest level since the start of tensions in the Middle East at the end of February.
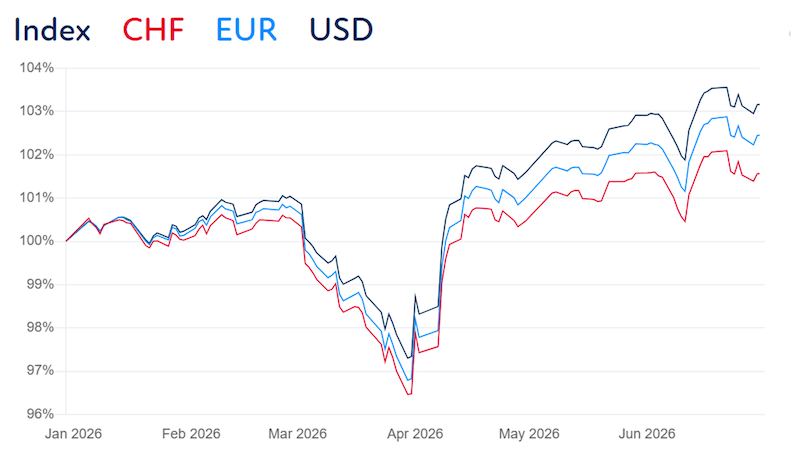
The SSPA Benchmark Index also posted a strong month. All three tranches reached new all-time highs. The broad strength of the underlying equity markets more than offset the slight weakness in US equities, allowing the index’s diversified methodology to continue its recovery. The EUR and USD tranches ended June 2026 with positive performance, while the CHF tranche posted a flat monthly result. The SSPA Benchmark Index is based on standardized Worst-of Barrier Reverse Convertibles linked to the S&P 500, the EURO STOXX 50 and the Nikkei 225. In general, rising underlying assets reduce the risk of barrier breaches. As a rolling portfolio made up of twelve monthly issuances, the index reflects both current market conditions and the gradual reinvestment into new Barrier Reverse Convertibles.

Volatility trends were more mixed across the three underlying markets. While the correction in US technology stocks led to a rise in implied volatility, implied volatility declined on both the EURO STOXX 50 and the Nikkei 225.
Despite these divergent volatility developments, coupon levels at the latest monthly index roll again increased compared with the previous month. At the end of June, new Barrier Reverse Convertibles were added to the index with coupons of 11.88% in USD, 10.03% in EUR and 7.54% in CHF, versus 10.97%, 9.35% and 6.91% respectively at the end of May.
For July, investors will be closely watching the next earnings season. Corporate results will show whether expectations for earnings growth are justified. The technology sector, which has delivered the strongest performance so far, will naturally remain in the spotlight. Markets will also keep a close eye on monetary policy decisions. The US Federal Reserve, the ECB and the Bank of Japan will hold their final meetings before the summer break.
For more information on the SSPA Benchmark Index, please visit: www.sspa.ch/fr/performance
| Ref. No. | Index | ISIN | Reuters Instrument Code (RIC) | Bloomberg Ticker | Year-to-date performance (YTD) as of 31.05.26 | 12-month performance as of 31.05.26 | Absolute index levels since launch (31.07.2024) as of 31.05.26 |
| 1 | SSPA MBRC CHF – Global Indices | DE000SL0RJT9 | .SPBRCCHF | SPBRCCHF Index | 1.6% | 4.2% | 108.1 |
| 2 | SSPA MBRC EUR – Global Indices | DE000SL0RE17 | .SPBRCEUR | SPBRCEUR Index | 2.4% | 6.2% | 112.2 |
| 3 | SSPA MBRC USD –Global Indices | DE000SL0RE09 | .SPBRCUSD | SPBRCUSD Index | 3.2% | 8.4% | 116.0 |
Find all our press releases